Amplifier AI
- 2020–2026
- Amplifier AI
About
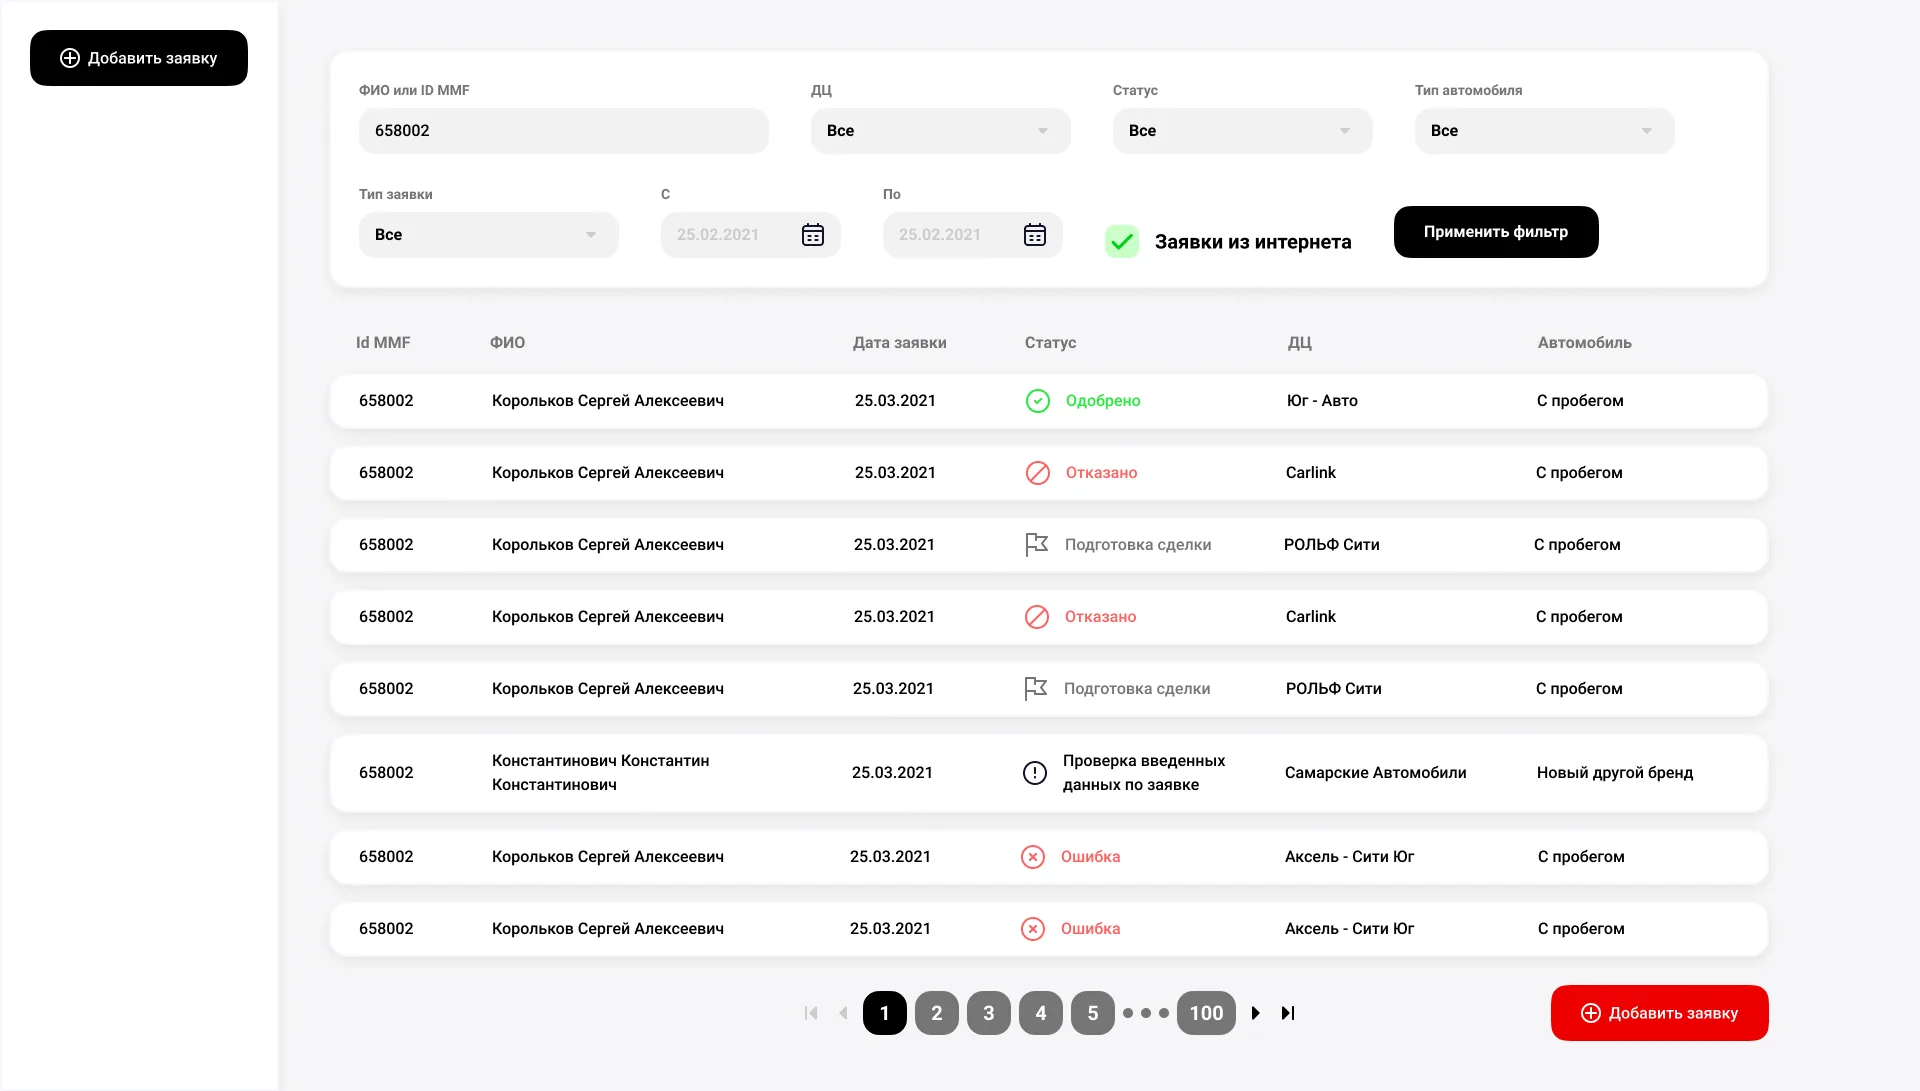
Amplifier AI is a Silicon Valley medtech startup that makes tools for radiologists and surgeons. We designed its VR interface for MRI: doctors open scans as 3D volumes, turn them in any plane, cut and measure them, and bring colleagues into the same scan. Later we designed the desktop planning platform, the website, the investor deck, print and the exhibition stand, and made the promo videos.
Challenge
Radiologists and surgeons were already using the VR tool, but every new tool had been added to whatever controller button was still free, until actions needed several buttons at once. Before the next funding round the team needed the scenarios simplified, the tools brought into one consistent system and an interface that looks finished in front of investors.
Approach
We started with a user flow of every screen and function and looked for the places where scenarios got heavy. Tools and settings moved to two separate menus on the two controllers, the tool menu became a ring around the controller, and several kinds of rulers merged into one that changes its behaviour with the task, so a doctor who works with scans for hours makes fewer moves.
The tool ring
Working with a scan
In the headset a doctor opens a scan library, picks a study and works with it in 3D. Each tool lives on a glowing floating panel: lighting presets that change how tissue reads, rulers and projection points for measuring, cut planes, screenshots and scene settings.
Together in one scan
A six-digit code lets a colleague join the same scan, so a case can be discussed together.
Built in VR
We laid out the panels in VR from the first sketches so the client could try them early, prototyped the interactions in Unreal and Unity, then animated every panel and tool and cut them into a showreel. The promo videos use the same visual language.
A planning platform for the desktop
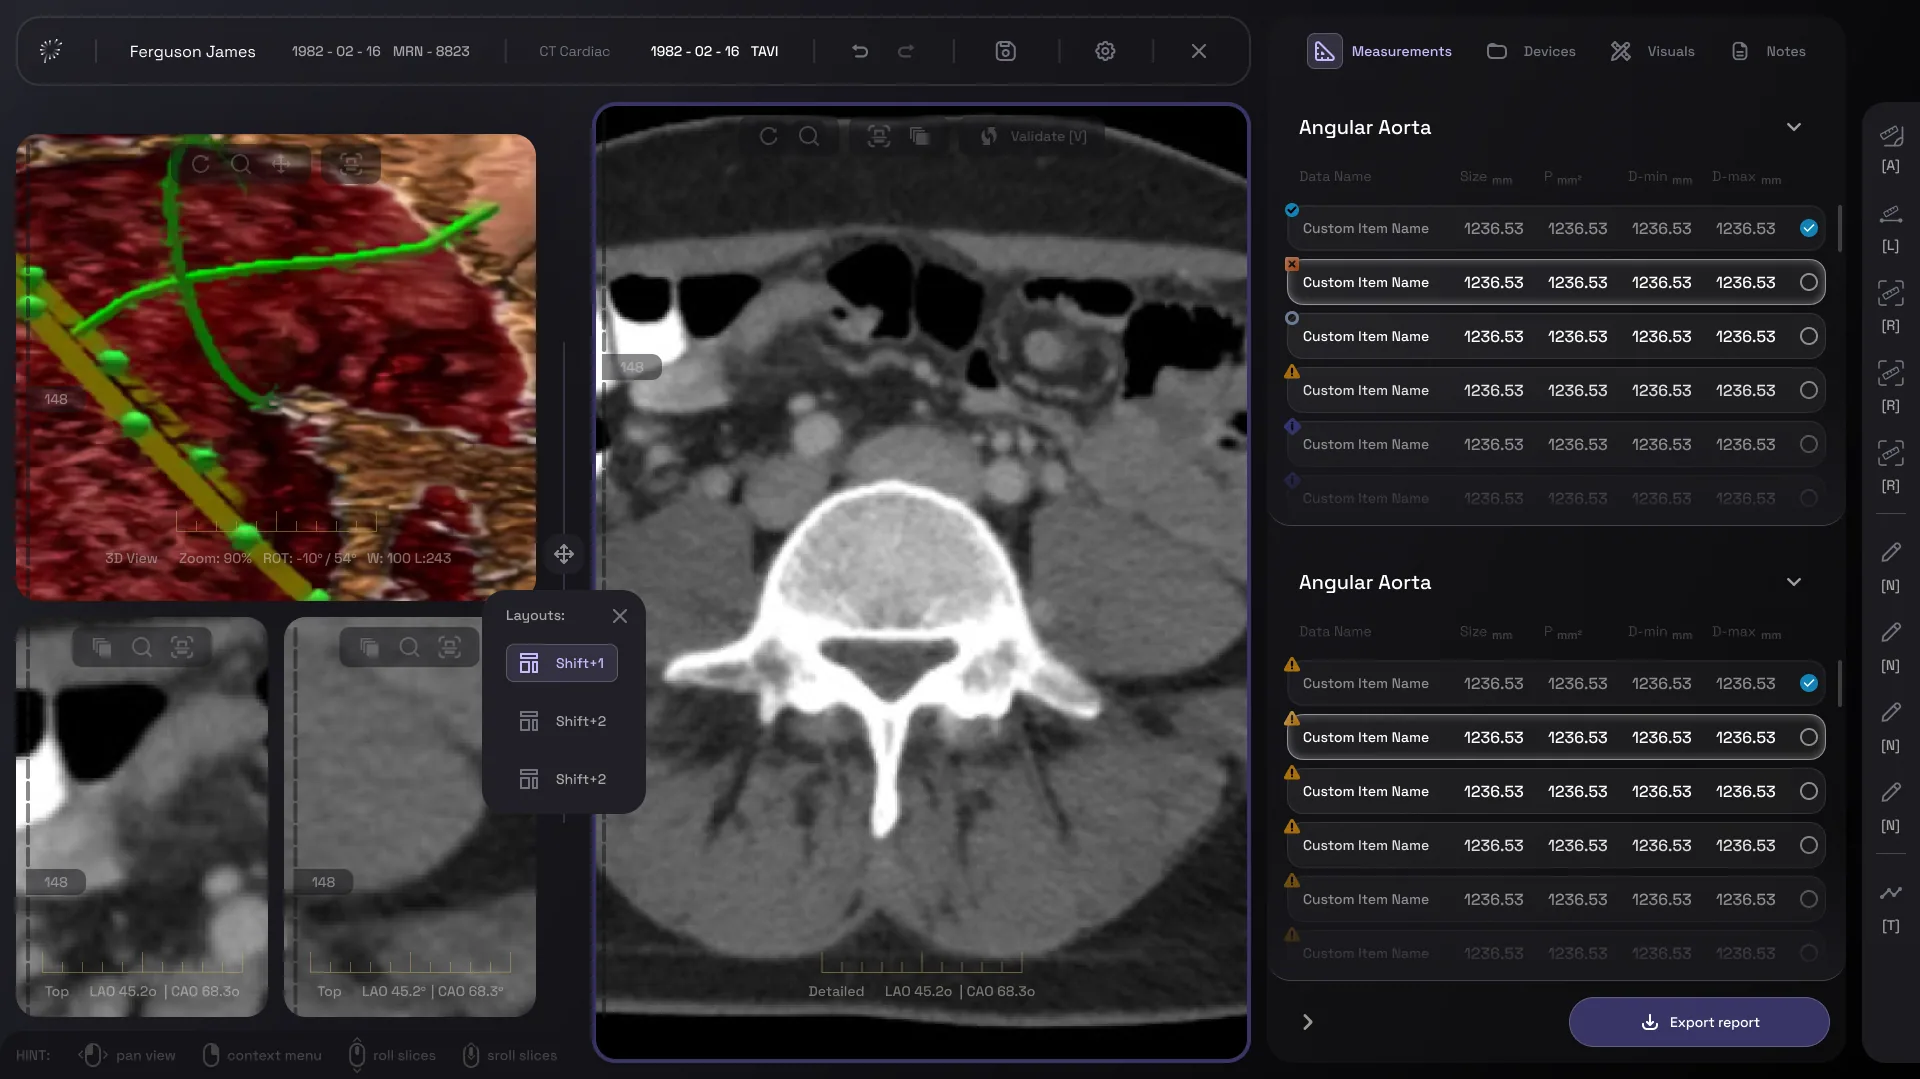
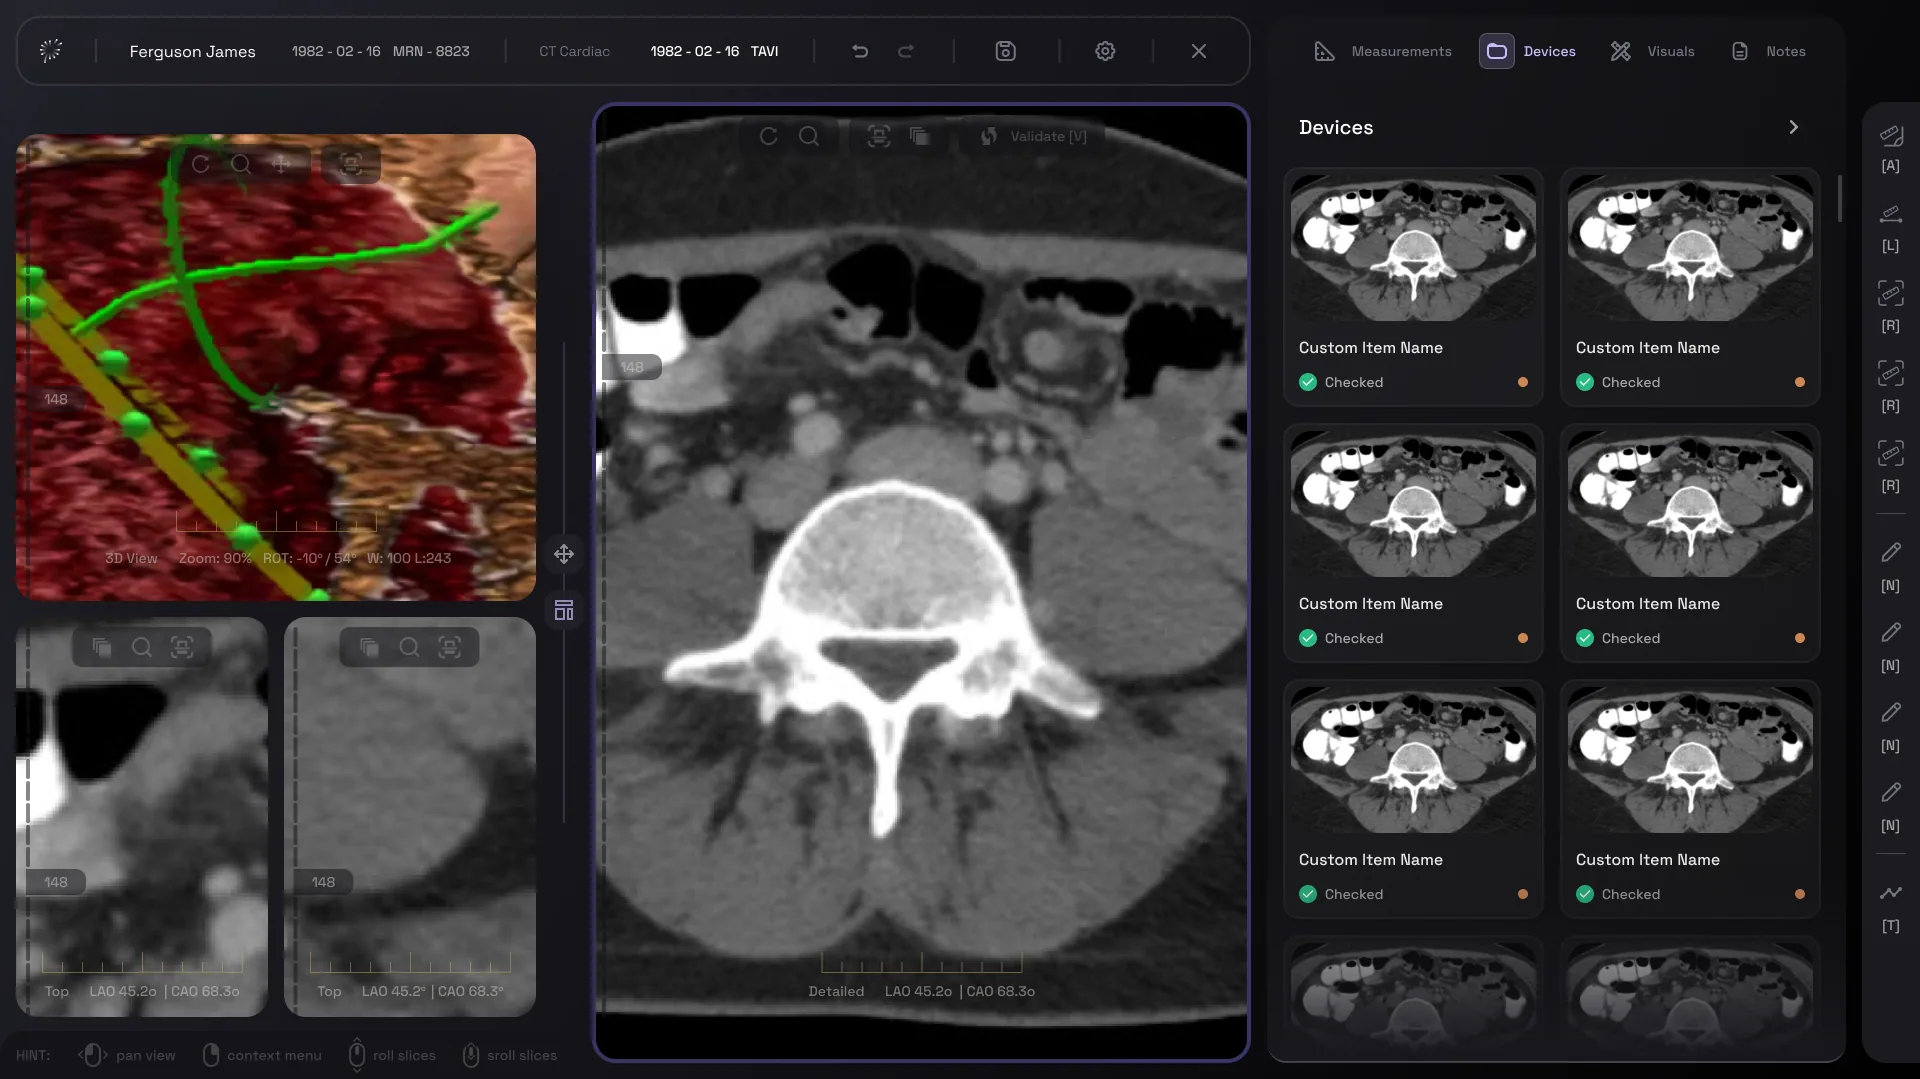
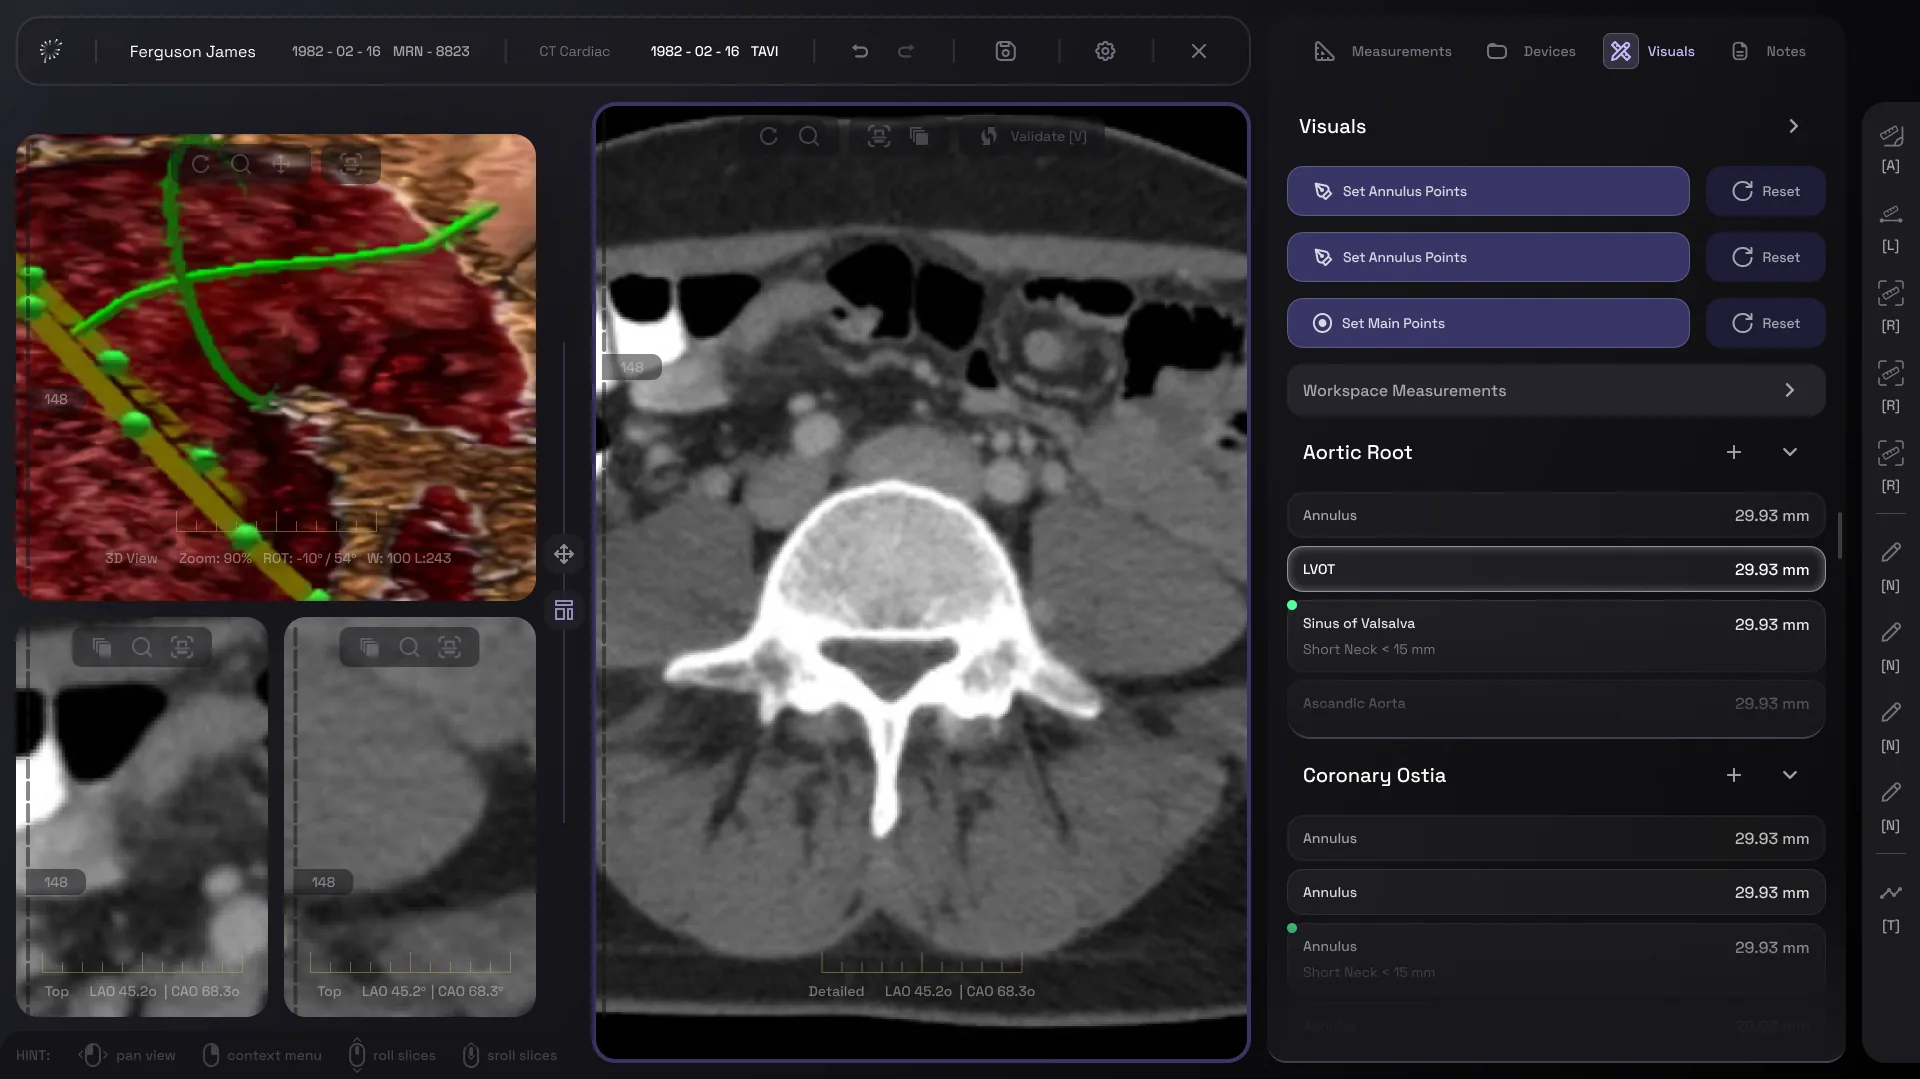
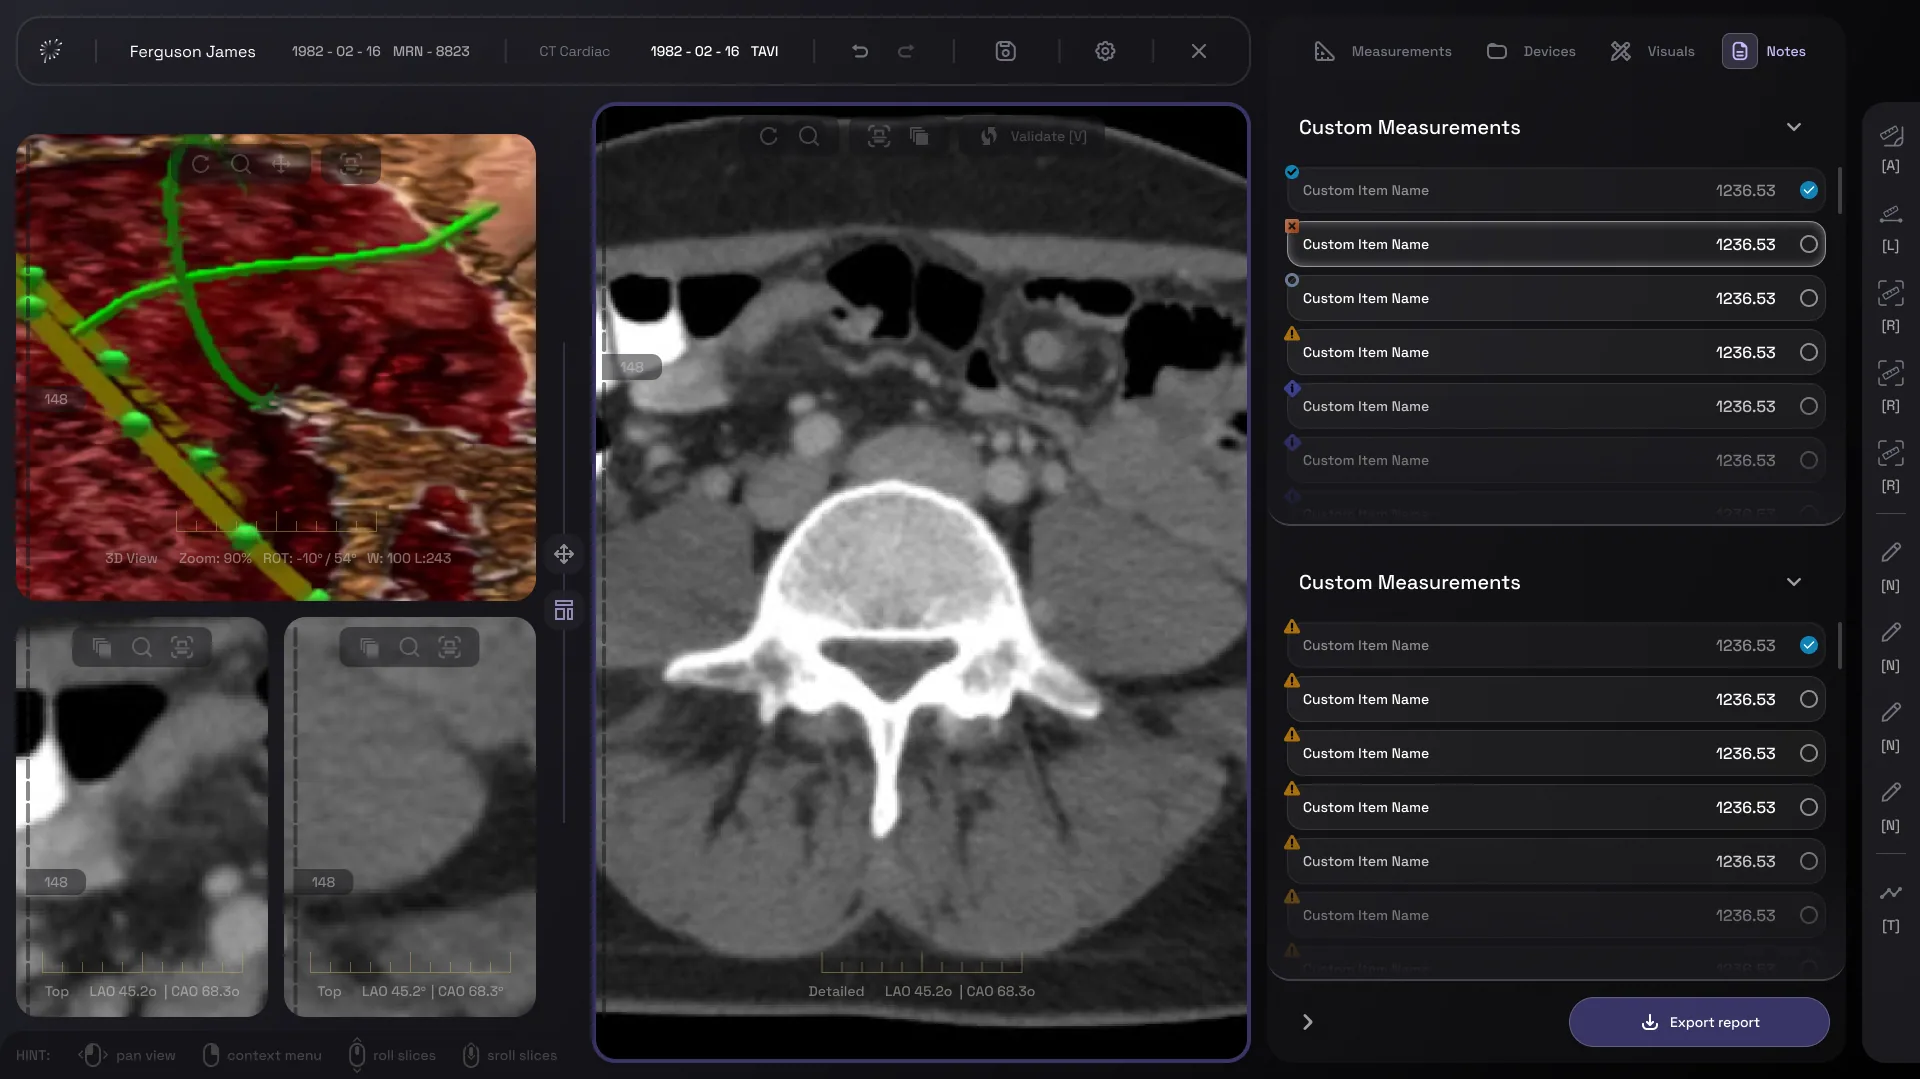
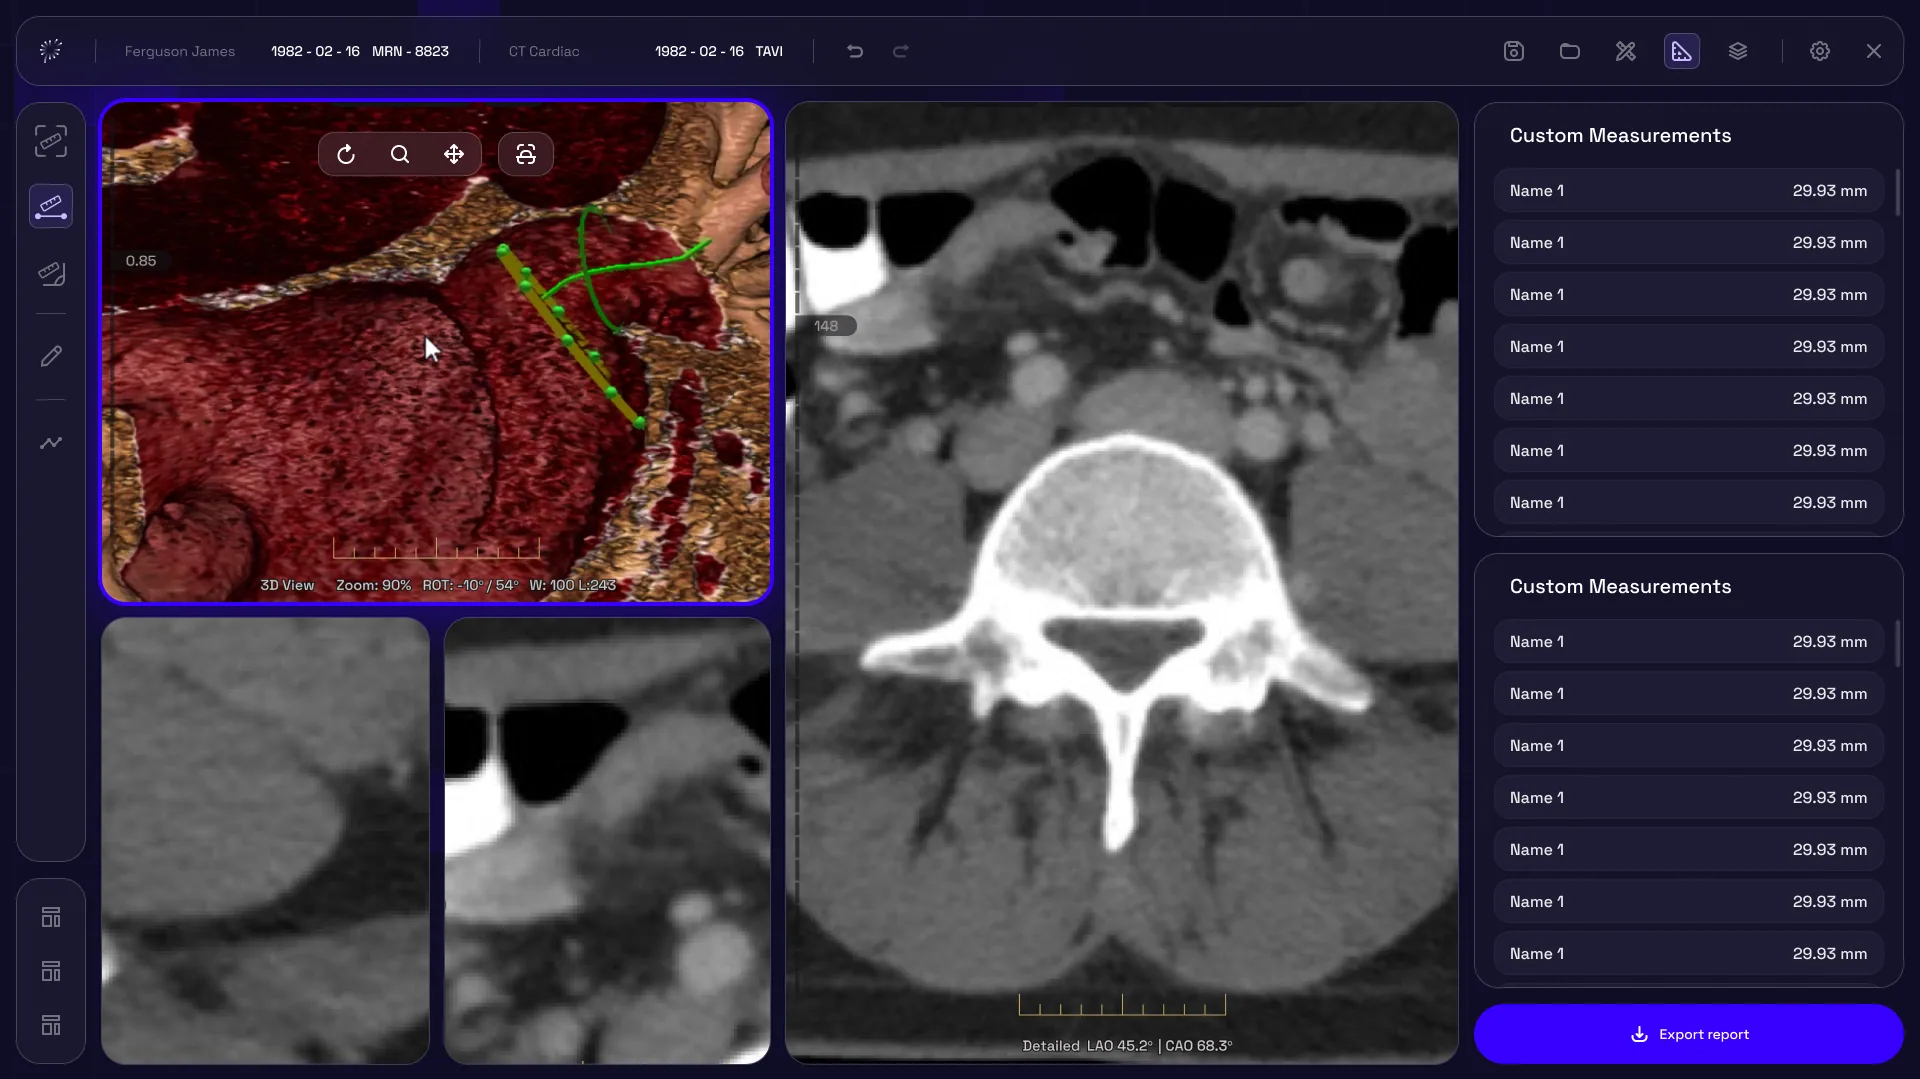
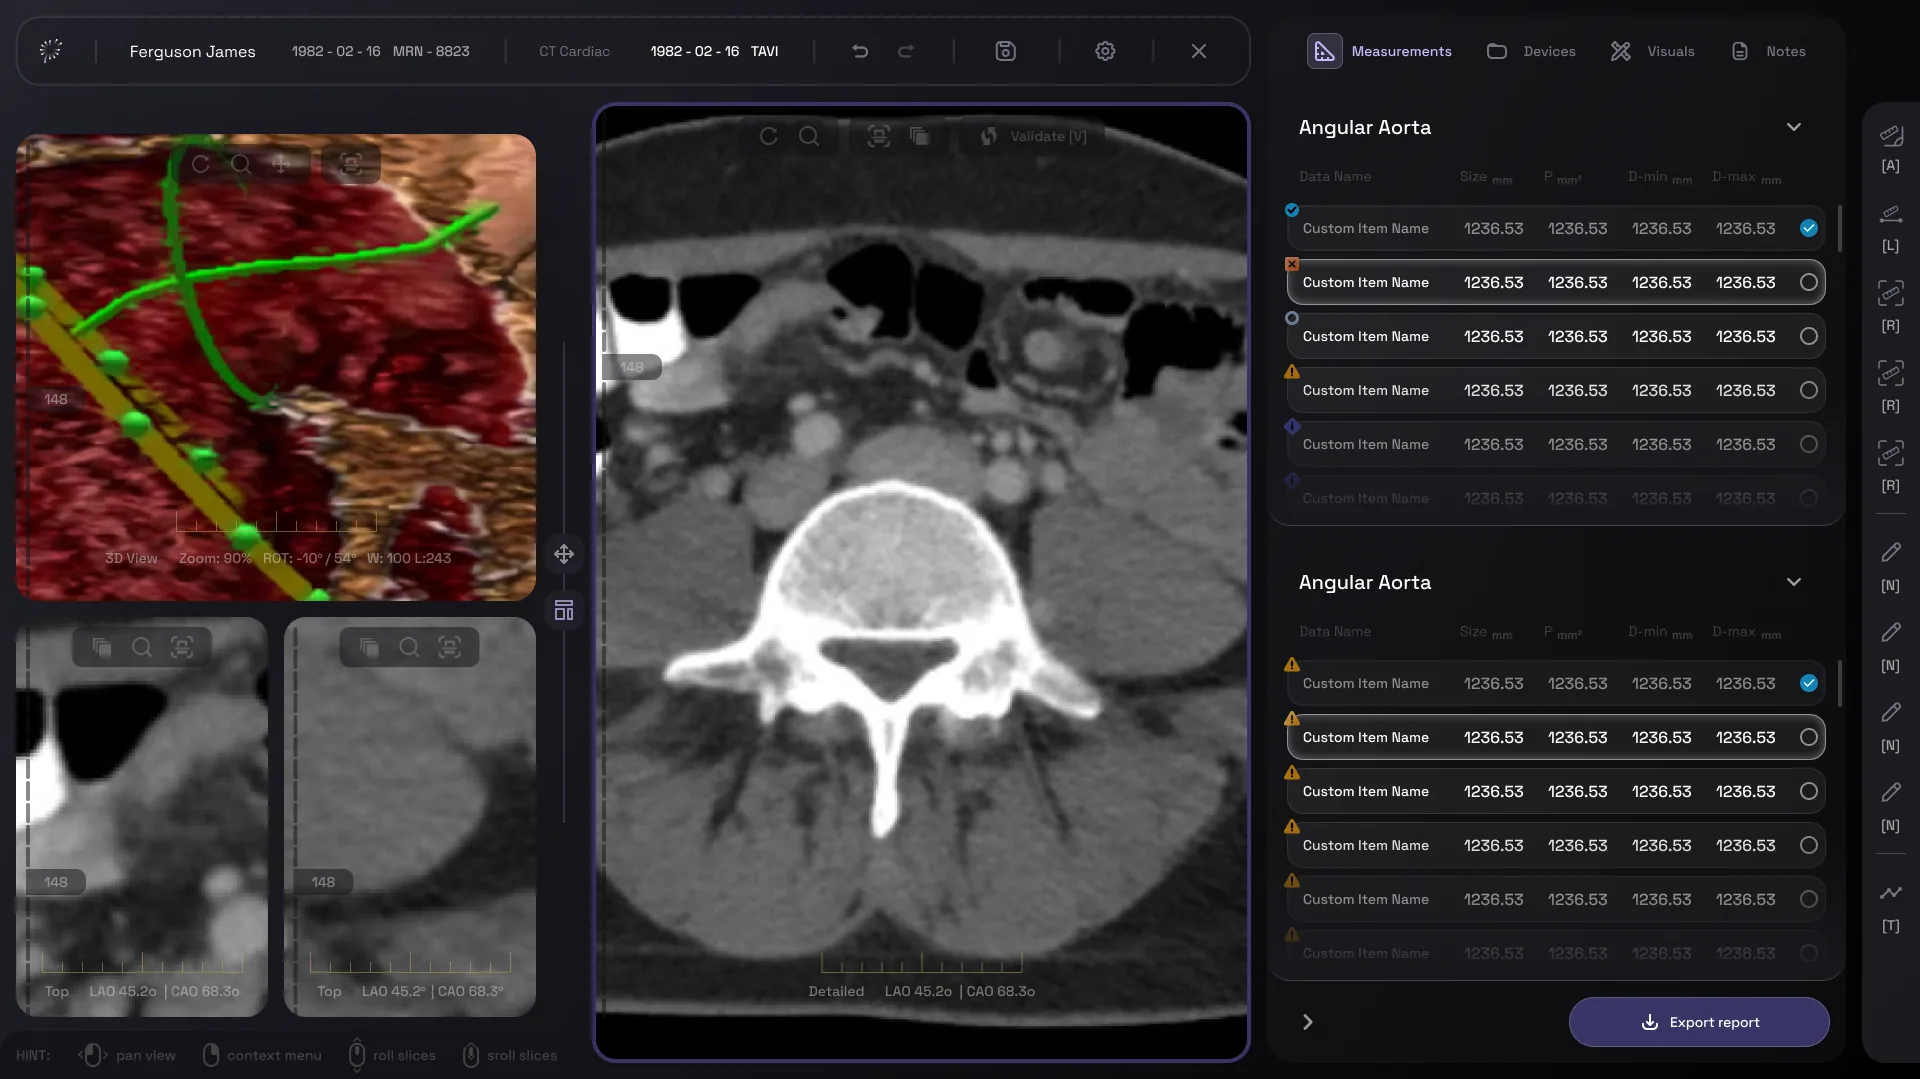
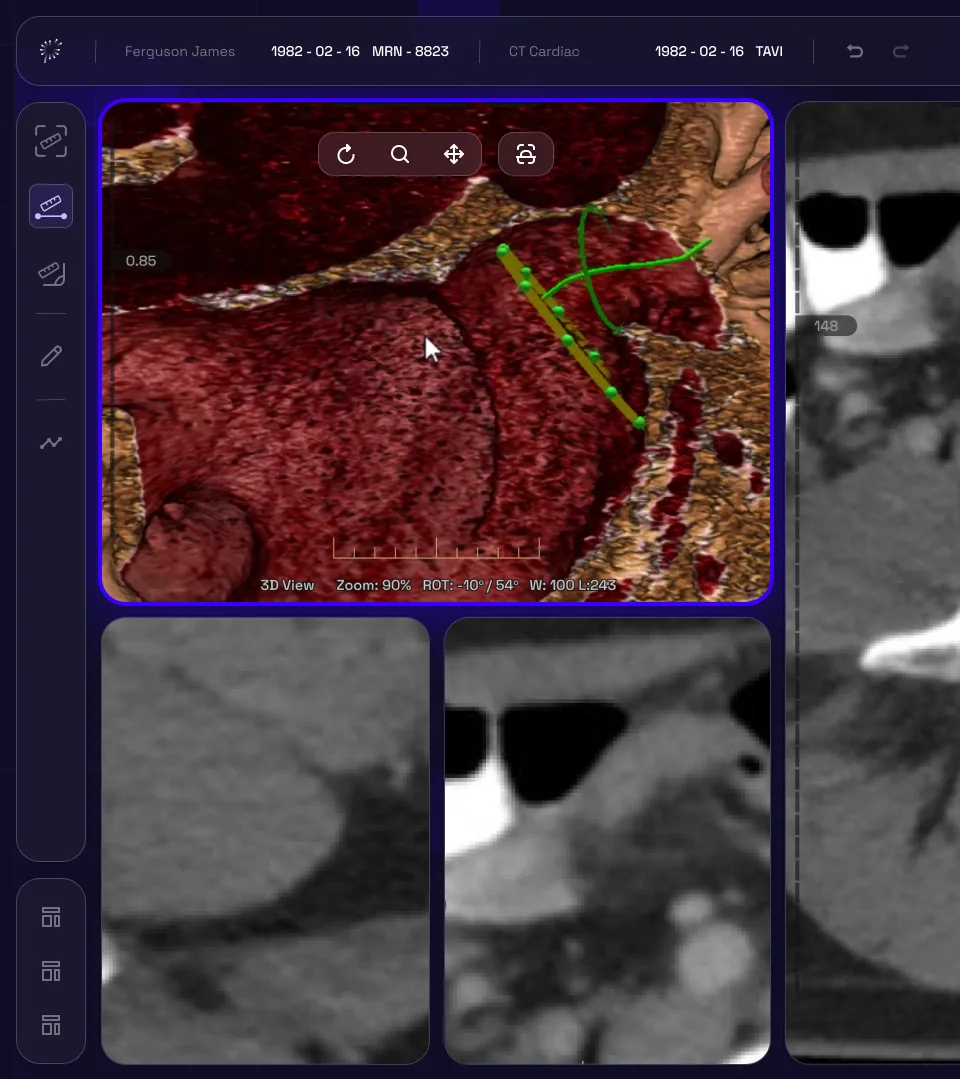
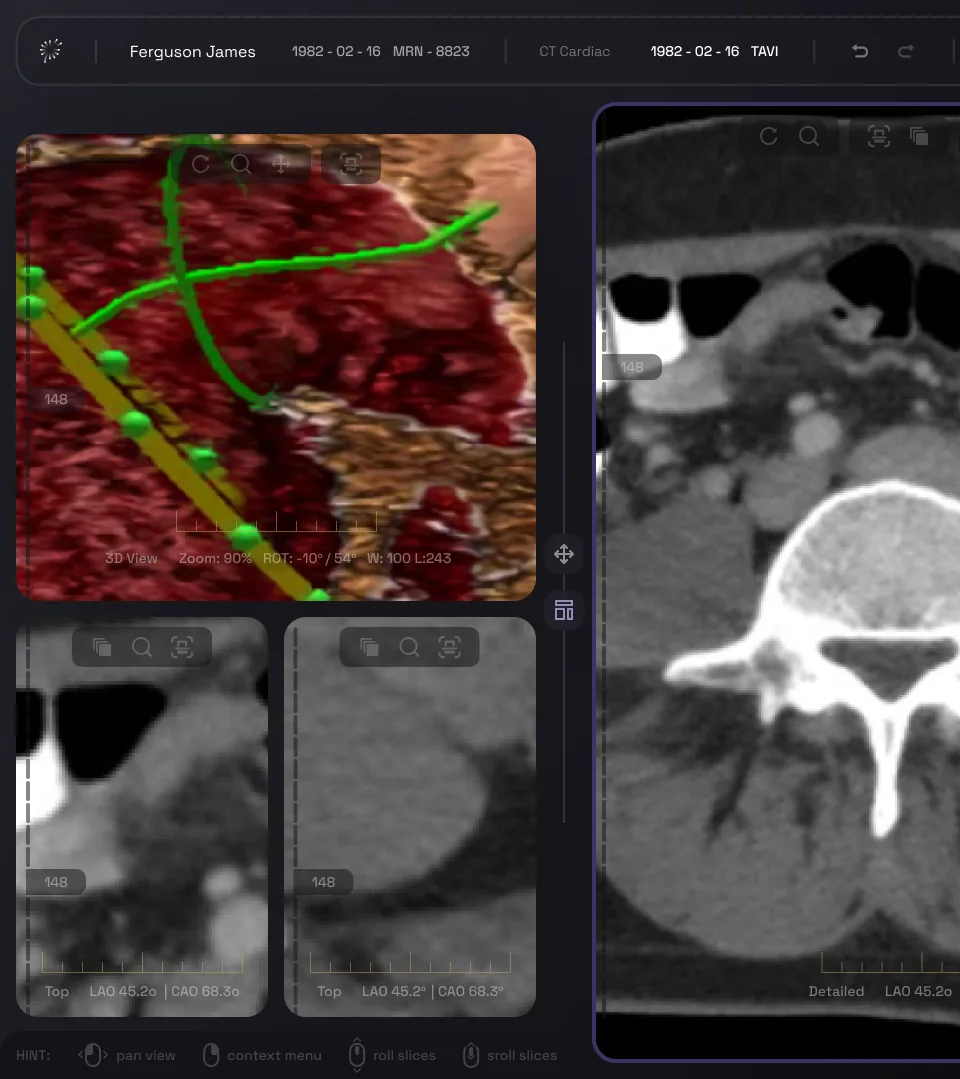
For planning on an ordinary screen we designed a desktop platform. The 3D anatomy, two CT views and the main slice sit side by side, and a panel on the right holds the measurements, devices, visual settings and notes, with a button that exports the report.
The right panel
Measurements
Every anatomy gets its own list with the size, area and minimum and maximum diameter of each item, and a mark for its status. A hotkey menu switches the layout of the views.
Devices
Device checks sit in a grid of CT slices, each with its status.
Visuals
Here the surgeon sets the annulus and main points on the scan, next to the aortic root and coronary ostia measurements.
Notes
Custom measurements for the case, ready to go out in the report.
Six rounds of the layout
Revisualizing surgery
The website
The site speaks to surgeons, hospitals and medical device companies at once. Solution pages walk through DIEP flap planning, EVAR sizing and valve planning in VR, each audience has its own benefits page, and the team, blog, pricing and FAQ sit alongside. Every page has a mobile version.
Home page

Solutions, benefits, team and blog
On a phone
The investor deck
For investors we made the deck in the same visual language as the site: the problem, the solution, the clinical and economic impact and what sets the platform apart.
Roll-ups, a brochure and the stand
We designed roll-ups in Portuguese with a QR code to book a demo, a tri-fold brochure first in Portuguese and then in English, and the graphics for an exhibition stand: the front and side walls and the counter.
Roll-ups
Tri-fold brochure, outside and inside
Stand, front wall
Side wall and counter
Results
Up to 50%
More lives saved, in the client's own estimate
$10M
Investment raised
2x
Doctors' throughput and diagnostic accuracy
Outcome
Radiologists and surgeons at Israeli medical centres work with the tool and use it to plan real operations. The company is growing and entering new markets, and we still work with the team.
Scope
- XR design
- UX and use cases
- Product design
- Interaction prototypes
- Platform design
- Website
- Pitch deck
- Exhibition stand
- Motion design
- Promo videos